Performance regression between Percona Server 5.6 & 5.7
I) An upgrade which hasn't gone as planned
One of our customer needed help after trying to upgrade their slave from Percona Server 5.6 to Percona Server 5.7. (here 5.7.17 is used)Indeed, from time to time, the replication lag was linearly growing, which could be quite annoying...
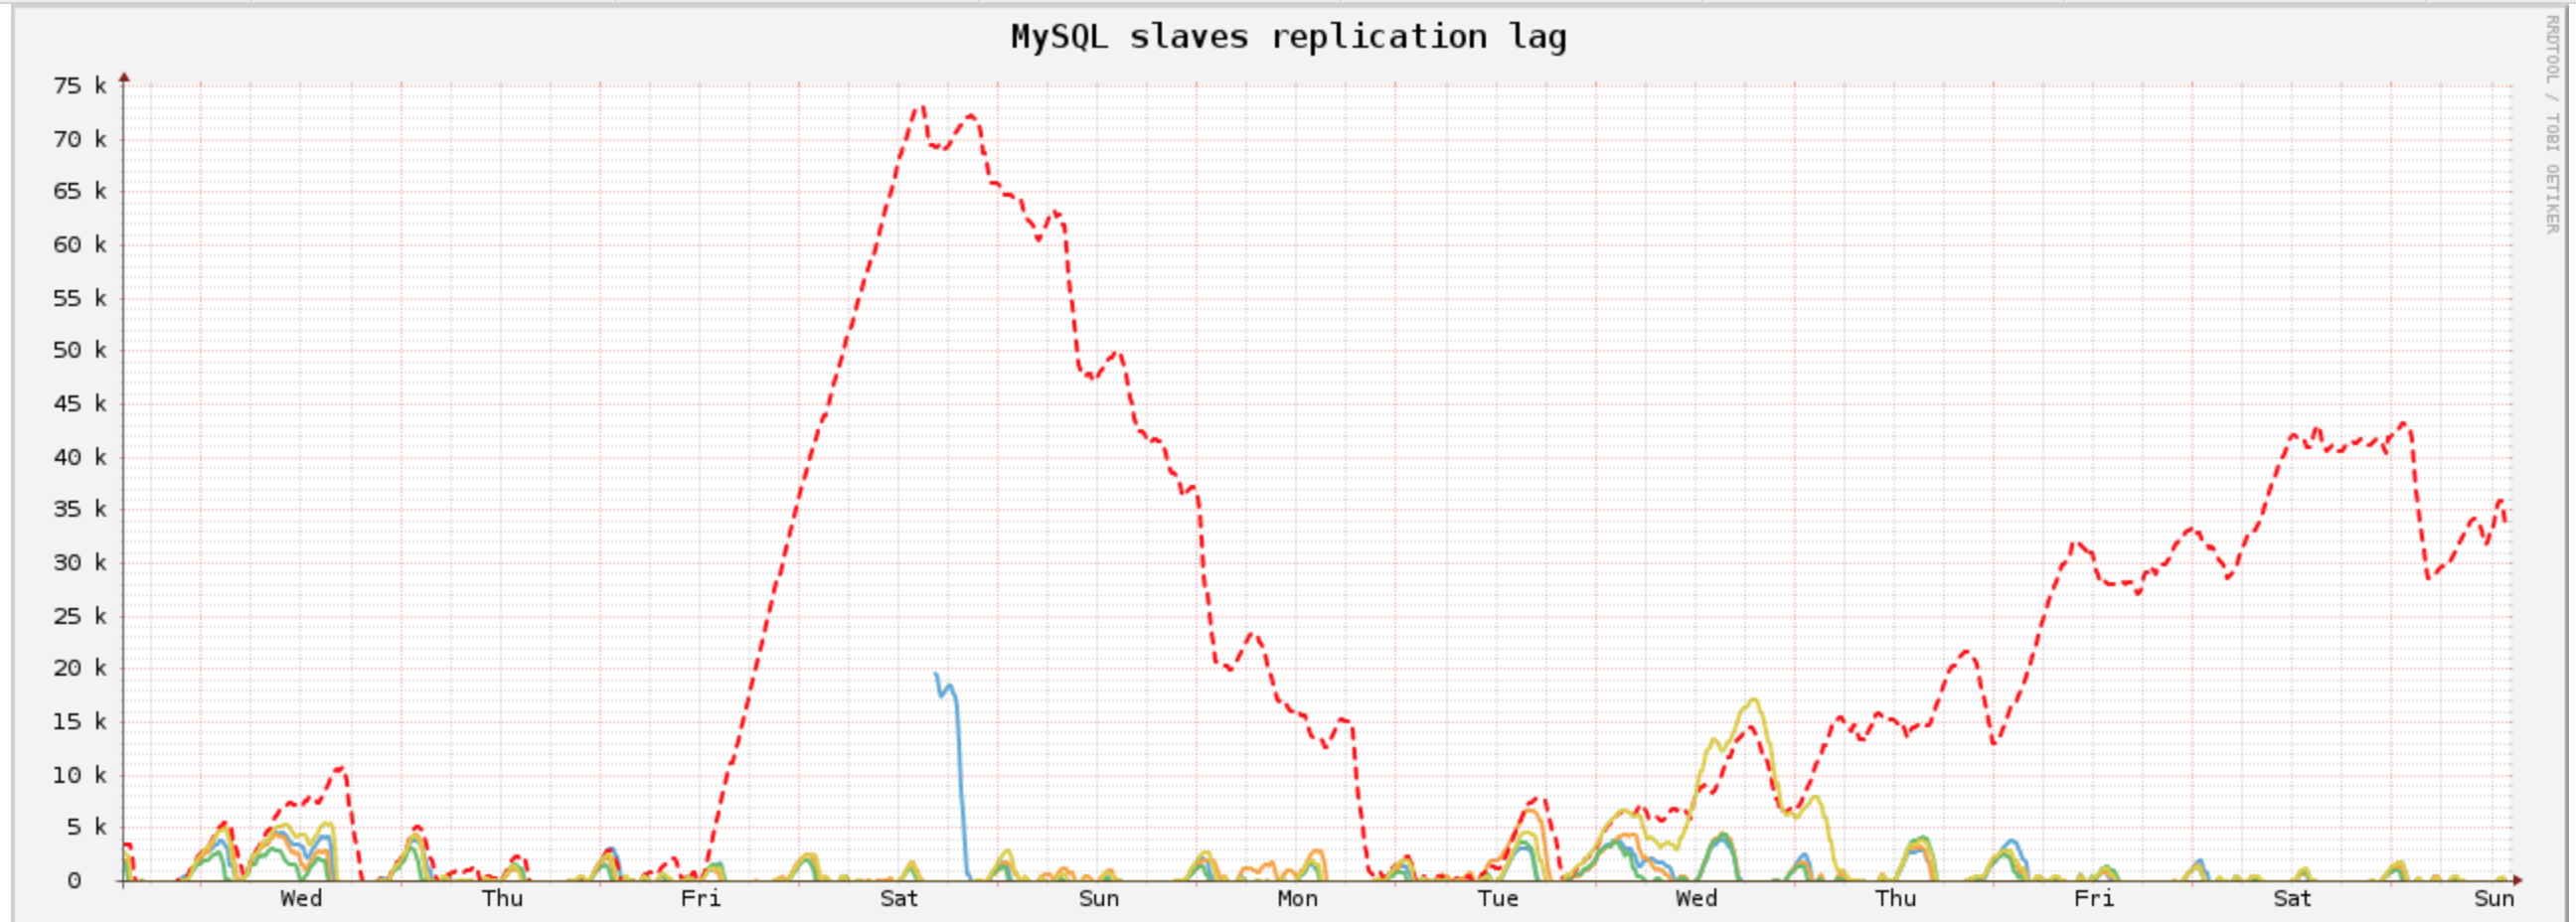
(good guess, 5.7 is the red dashed line!)
Their use case is quite interesting :
- a lot of Queries Per Second (read & write, nearly 10k queries/s on this slave)
- a lot of tables (about 600k spread across different databases)
- a lot of writes
- 24 CPUs, and 386G of RAM
- A big buffer pool (270G)
- not that fast SSD disks.
The idea is to make sure to not flush too fast on disk the dirty pages in the innodb buffer pool, and to have enough room in the redo log. The most important settings to maintain a good balance are:
- innodb_io_capacity=2000
- innodb_io_capacity_max=12000
- innodb_log_file_size=32G
In practical, with those settings, the server has about 24% of dirty pages, and 20% of redo log used in average under a "normal" usage.
It seems to be not bad, so why the server is sometimes so slow?
II) Let's investigate!
a) The LRU manager
I have first investigated if the innodb buffer pool flush was working properly. Although it was not the main cause of the performance regression, I noticed a new threaded LRU (Least Recently Used) manager has been introduced in XtraDB 5.7. Basically, for each buffer pool instance, a list of dirty pages is stored in an LRU queue. The job of this LRU manager is to flush a few dirty pages, when there are not enough free pages available in the buffer pool.However, the mecanism to wake up those threads is not optimal: it's based on a timer which will wake up the thread every 1s + an extra time which is auto-ajusted depending on the size of the buffer pool free list and what happened during the last thread execution.
With this implementation, XtraDB is spending a lot of CPU cycle sleeping (thru the use of the os_thread_sleep function). A better implementation would be perhaps to use an event wait which would trigger a thread wake up once the free list reaches some defined threshold.
As a result, I opened a bug report on percona server to report this issue:
https://bugs.launchpad.net/percona-server/+bug/1690399
For the record, Mark Callaghan already opened a few years ago a bug report on MySQL asking to try to remove the os_thread_sleep calls : https://bugs.mysql.com/bug.php?id=68588
I've just noticed XtraDB 5.7.18 included a few improvement in the LRU Manager, we need to test if it improves things: https://bugs.launchpad.net/percona-server/+bug/1631309
b) ALTER TABLE are slow!
Well actually, it's not always the case, that's why it was tricky to track it down.It's worth noting this ALTER TABLE issue in an upstream bug, from MySQL 5.7 (thanks Marko Mäkelä for noticing it). So this one is affecting Percona Server 5.7, MySQL 5.7 and MariaDB 10.2.
The workload of this customer can create from time to time a few new tables, fill them, and use an ALTER TABLE to add new indexes.
In the introduction, I mentioned the server has been fine tuned to avoid flushing too much the buffer pool. It means the amount of dirty pages is potentially high, depending on the size of the buffer pool. In our case, with 24% of dirty pages, it represents about 4.2m of dirty pages.
The issue in 5.7 is that when we rebuild an index, the function FlushObserver:flush is called to flush the dirty pages associated with the modified table. Before doing the flush, it tries to count the number of dirty pages to estimate the amount of time the operation could take. Unfortunately, the implementation of this count is really inefficient : it iterates on all the buffer pool instances, and for each buffer pool, on all the dirty pages, to try to find those one corresponding to the modified table.
With 4.2m of dirty pages, it means it iterates on 4.2m dirty pages (even if the table is empty!).
Here are the performance results:
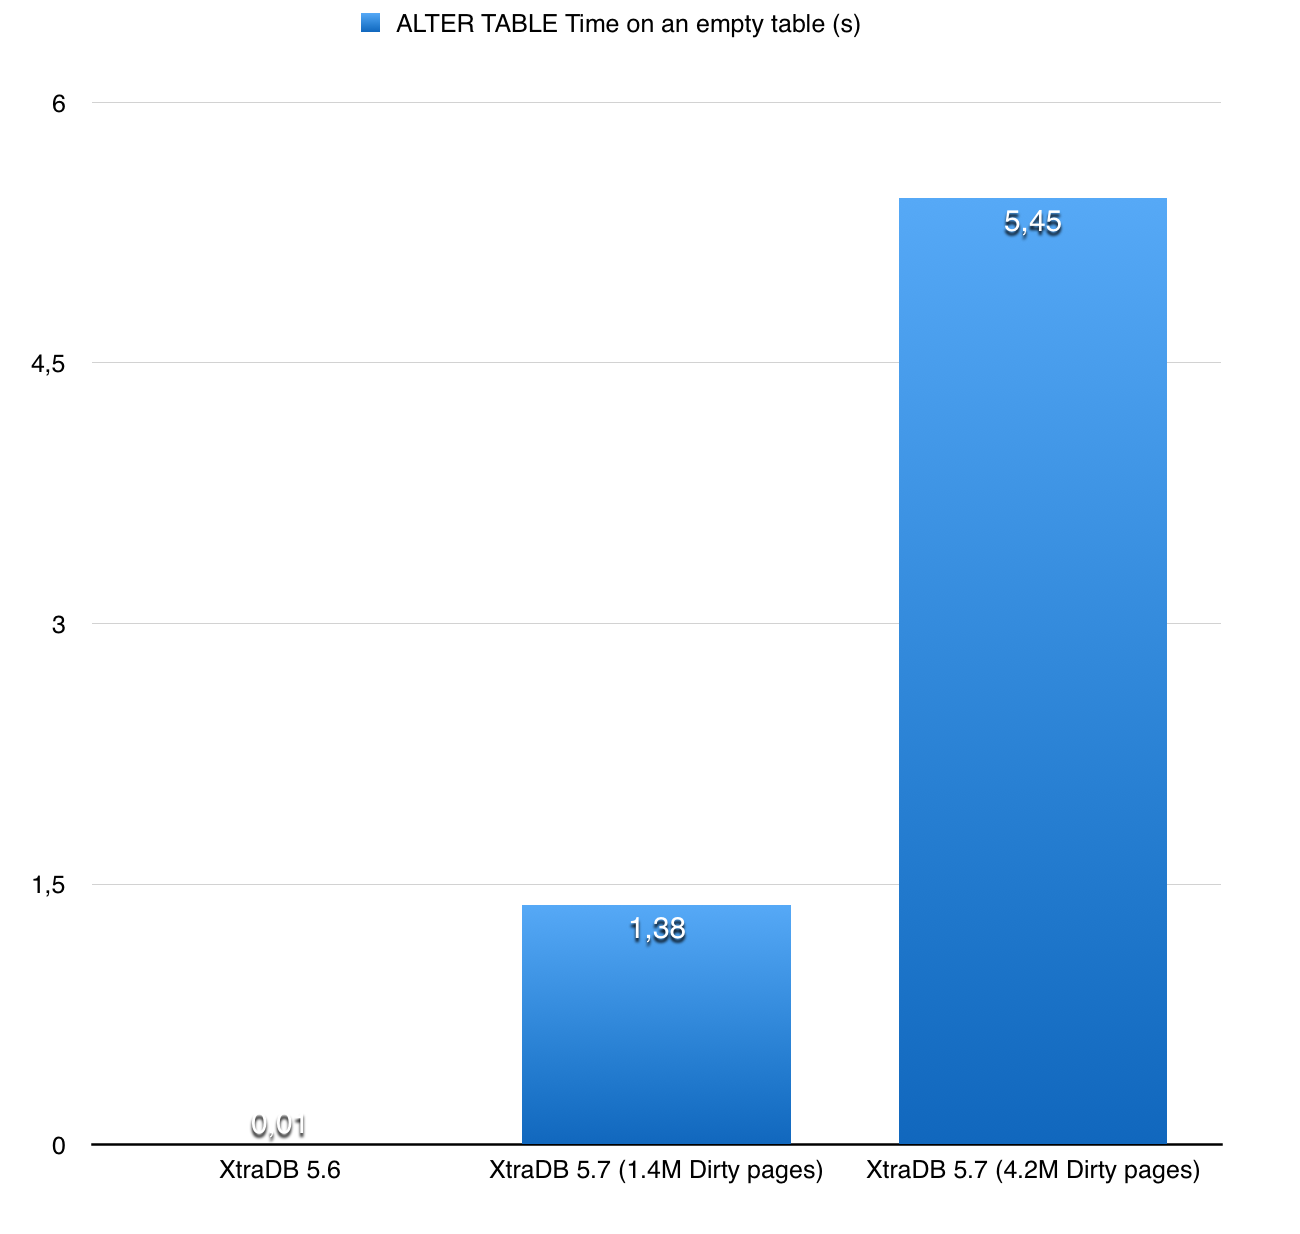
I created another bug report for this specific issue : https://bugs.launchpad.net/percona-server/+bug/1690588
Let's hope they will fix those issues quickly!